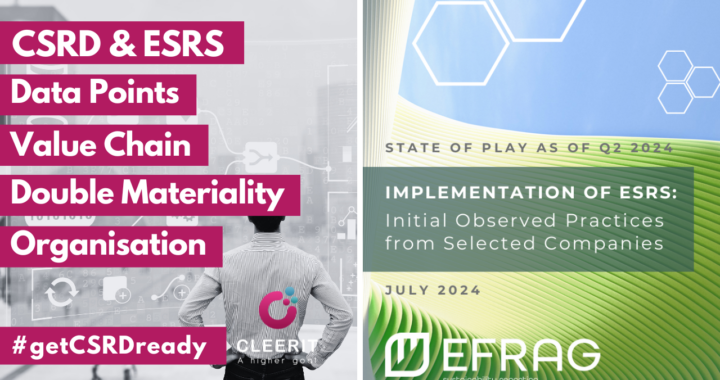
EFRAG has prepared a report, with the support of the Boston Consulting Group, based on a study aimed at understanding how undertakings are preparing to apply the European Sustainability Reporting Standards (ESRS) required for compliance with the CSRD.
The report illustrates preliminary observed practices and challenges in their initial phase of ESRS implementation as of Q2 2024, divided into 4 sections:
- Organisational approach
- Double Materiality Assessment
- Value Chain mapping
- Reporting on ESRS Data Points
Below you will find valuable key takeaways. The full report can be downloaded here >>.
1. Organisational set-up for CSRD-related activities
⭕ Cross-functional collaboration models are set up to meet the ESRS requirements more effectively
All companies deploy cross-departmental collaboration.
The ownership model for the ESG reporting process is being discussed by most companies and may evolve in the future.
Currently ~65% allocate ownership to a single function (e.g., the Chief Sustainability Officer or Chief Financial Officer), while ~35% adopt a co-leadership approach (e.g., CFO in charge of reporting, CSO in charge of DMA).
Typically, five or more departments are regularly engaged in the CSRD implementation process.
Beyond the Sustainability and Finance departments, Risk Management, Human Resources, and Auditing or Internal Controls are the most frequently involved.
Departments such as Procurement, Communications, and Strategy are also commonly engaged, reflecting the interdisciplinary nature of effective ESG reporting.
30% are expecting changes in the organisational model in the near or medium term.
Upskilling is needed for any of the departments in the lead role (e.g., Sustainability on Internal Controls, Finance on ESG content).
Clear governance and forums are needed to exchange updates and implications for the other functions and make decisions.
~90% have started improving data quality controls, similar to those used for financial reporting.
~85% acknowledge the need for IT transformation.
⭕ The companies expressed consensus that CSRD reporting has:
1️⃣ Enhanced cross-departmental collaboration (e.g., between Sustainability, Finance, Risk, IT and business units).
2️⃣ Highlighted the need for standardising the ESG reporting processes, including data quality controls (akin to financial reporting), in particular in preparation for assurance.
3️⃣ Required several additional capabilities and resources (FTE, knowledge, data and technology), including the need for an IT transformation, to be implemented under different timelines (some companies are starting sooner than others).
2. Double Materiality Assessment (DMA) practices
⭕ A strategic tool for setting ESG managerial priorities
~85% intend to integrate ESG reporting and the result of the DMA into business strategy and decision making.
A few consider DMA as a compliance exercise.
⭕ An overall shift in the DMA process is being observed
DMA is moving away from a judgement-based approach adopted in the previous years.
~70% now apply an objective evidence-based approach and rely mainly on internal and third-party data.
Where data is not available, information is complemented by the judgement of internal experts and stakeholders.
Quantitative measures of IROs (Impacts, Risks, Opportunities) are objective evidence of their materiality. Qualitative information may provide relevant context for understanding quantitative measures.
⭕“Internal expert” refers to
individuals within the organisation who possess specialised knowledge, skills or experience relevant to the environment, social or governance matters analysed or disclosed for sustainability reporting.
⭕ “Stakeholder” refers to
individuals, groups, or organisations external to the company, who can affect or be affected by the company,
including affected stakeholders and users of sustainability statements.
⭕ “Objective evidence-based” refers to
Internal data (e.g., Risk data and thresholds supplied by risk management; Opportunities based on internal projections supplied by strategy departments).
Third-party data (e.g., topic-specific databases; or in-house research on scientific papers).
Input of internal experts and stakeholders, including affected stakeholders for impact materiality.
This excludes results of generic surveys that are not targeted to specific affected stakeholder groups and narrowed to the matters that affect them.
Several highlight that surveys are not the preferred engagement channel as they often result in inconclusive output or insufficient stakeholder expertise.
⭕ “Judgement-based” refers to
Aggregation of views typically gathered through investigations/surveys/workshops with inputs from stakeholders and internal contributors (not necessarily by targeting engagements according to the level of expertise on ESG topics).
Key challenge: possible divergent views on different topics potentially leading to a subjective assessment not anchored to data.
⭕ Financial materiality thresholds
Risks: companies use both data and thresholds developed by the risk management division on ESG risk mapping (ranges expressed in millions of Euros and on different metrics as Revenues, CAPEX, and OPEX).
Opportunities: companies use business thresholds that make a business case material.
⭕ Impact materiality thresholds
Scale: is set by making use of objective external sources as much as possible (including industry proxies).
Scope: is defined according to geographical considerations on the specific topic (e.g., local vs. global footprint) and in line with where the company has established a business presence.
⭕ Interrelation between financial and impact materiality is highlighted
For instance, within the topic of health and safety, there is the human (social) impact of injury and fatalities, as well the financial risk of compensation and the wider reputational risk of an unsafe workplace.
3. Value Chain (VC) practices
⭕ VC mapping
Mapping of relationships, associated actors and financial transactions, is used to achieve visibility into the VC and connected IROs (impacts, risks, opportunities).
VC analysis remains one of the most challenging and least mature areas in ESRS implementation.
~90% are still working to refine their VC mapping, looking for the right balance of granularity.
Several have adopted a simplified aggregated VC mapping (i.e., upstream, downstream and own operations only).
They use transitional provisions, available for the first 3 years of sustainability reporting under the ESRS, with possible higher efforts to go beyond Tier 1 for the next reporting cycles.
Tier 1 (direct business relationships) suppliers are the primary suppliers that provide goods and services directly to the organization.
⭕ Focusing on direct business relationships (Tier 1)
- Does not reflect material IROs linked to indirect business relationships.
- Will not be compliant with ESRS, in particular for sectors other than financial institutions.
- Not reflecting complexities of value chains raises potential information biases.
~45% have already adopted a more granular mapping of their value chain (i.e., going beyond the high-level upstream, downstream and own operations only).
Especially non-financial institutions are already going beyond Tier 1. They tend to have more visibility of their value chain due to ongoing activities (e.g., supplier screening), especially upstream.
⭕ VC hotspots and due diligence
Severity of impacts is used to prioritise efforts, focusing on VC hotspots.
“Hotspots” are specific areas of the VC where significant IROs are likely to materialise.
Potential ”hotspots” are identified by cross-referencing countries where materials are produced, to social and environmental risk databases (i.e., Type of impact by Country by Actor in the VC). These hotspots may then be further investigated.
Special attention is given to addressing risks such as child labour in specific geographies.
The mapping of the VC for material impacts is expected to use the sustainability due diligence process when it is in place.
⭕ VC aggregation
When aggregating VC components for clarity and manageability, criteria are based on similar business types, products, services, geographical locations and organisational setups.
Such aggregation should not dilute key VC components and should ensure that the internal organisation is reflected in the VC to maintain accountability.
Detailed segmentation enhances effective visibility, management and prioritisation of high-impact areas, supporting compliance and strategic focus on significant VC elements.
Conversely, VC components with no evidence of IROs are excluded.
4. ESRS Data Point (DP) practices
⭕ EFRAG’s Implementation Guidance 3 (IG 3 Excel list)
~95% of the undertakings use IG 3 for running their gap analysis.
~20% are currently using IG 3 as a preliminary base for the upcoming digital tagging/reporting taxonomy (XBRL taxonomy).
~80% mention the complexity of retrieving data, with similar obstacles found across E, S and G.
~75% leverage the phase-in of DPs to spread the preparation efforts. However, the effect of phase-ins needs to be properly communicated.
~40% leverage Information Materiality, a concept that does not yet seem to be well understood by the participants of the study.
~10% choose to report voluntary DPs for material topics because they opt for full disclosure of DPs on material topics.
⭕ Only a minority understand how to assess Information Materiality at a DP level
The materiality of information exercise, which has the potential to direct efforts where they are most needed (i.e., in assessing material DPs), is not fully understood by the participants in this study.
Only the ‘Shall’ DPs in ESRS 2 and DR IRO 1 DPs in topical standards are always to be reported.
All other ‘Shall’ DPs are (i) applicable only when the undertaking concludes that the relevant topic is material and (ii) subject to materiality under the provisions of ESRS 1 paragraph 31 to 35.
MDR DPs are all to be reported only for material matters, per each policy/action/target that the undertaking discloses.
Information Materiality refers to ESRS 1 Appendix E: Flowchart for determining disclosures under ESRS: “Is the individual datapoint material?”
In short:
1️⃣ Perform the impact and financial materiality assessment (DMA) – informed by the topics listed in AR 16 ESRS 1.
Narrative disclosures for material topics
2️⃣ If the topic is material, disclose the DPs from the topical standard.
3️⃣ Disclose the DPs for established policies, taken actions and targets for the topic, per each policy/action/target, as explained in ESRS 2 (MDR).
4️⃣ If no policies, actions and targets have been established, disclose this to be the case. You may report a timeframe in which you aim to have these in place (ESRS1 33).
Metrics for material DRs / DPs
5️⃣ If the Disclosure Requirement (DR) is material, disclose the information required by the DR and the related DPs.
6️⃣ If the individual DP is material, disclose the information required by the DP.
⭕ Key challenges when disclosing all DPs (no use of possible levers highlighted by EFRAG)
- Higher effort required in the short and long term for reporting.
- Not all DPs might always be relevant to users.
- Risk of obscuring material information.
- Potential lower quality of data due to higher coverage needs.
More on costs
Earlier in the process, EFRAG also commissioned Centre for European Policy Studies (CEPS) and its partner Milieu to conduct an assessment of the costs and benefits of the first Set 1 of Draft ESRS presented in November 2022:
- Looking at administrative costs in absolute terms, the largest cost in absolute value (both one-off and recurring) is faced by NFRD listed undertakings.
- These are usually large undertakings requiring longer data collection processes.
- They expect to face, on average, a total of EUR 287 000 as a one-off cost of reporting and about EUR 320 000 on annual basis (of which EUR 173 000 for own costs equivalent to between 2 and 2.5 FTEs on average).
- Non-NFRD non-listed undertakings incur the lowest administrative costs, primarily due to their smaller average size. Their costs are expected to reach about EUR 36 000 on a one-off basis and EUR 40 000 on a recurring basis.
The SaaS solution Cleerit ESG
✅ Adopt a streamlined taxonomy-centric ESRS report preparation with the SaaS solution Cleerit ESG > Book a demo.
And stay tuned for additional ESRS insights on our LinkedIn page >.